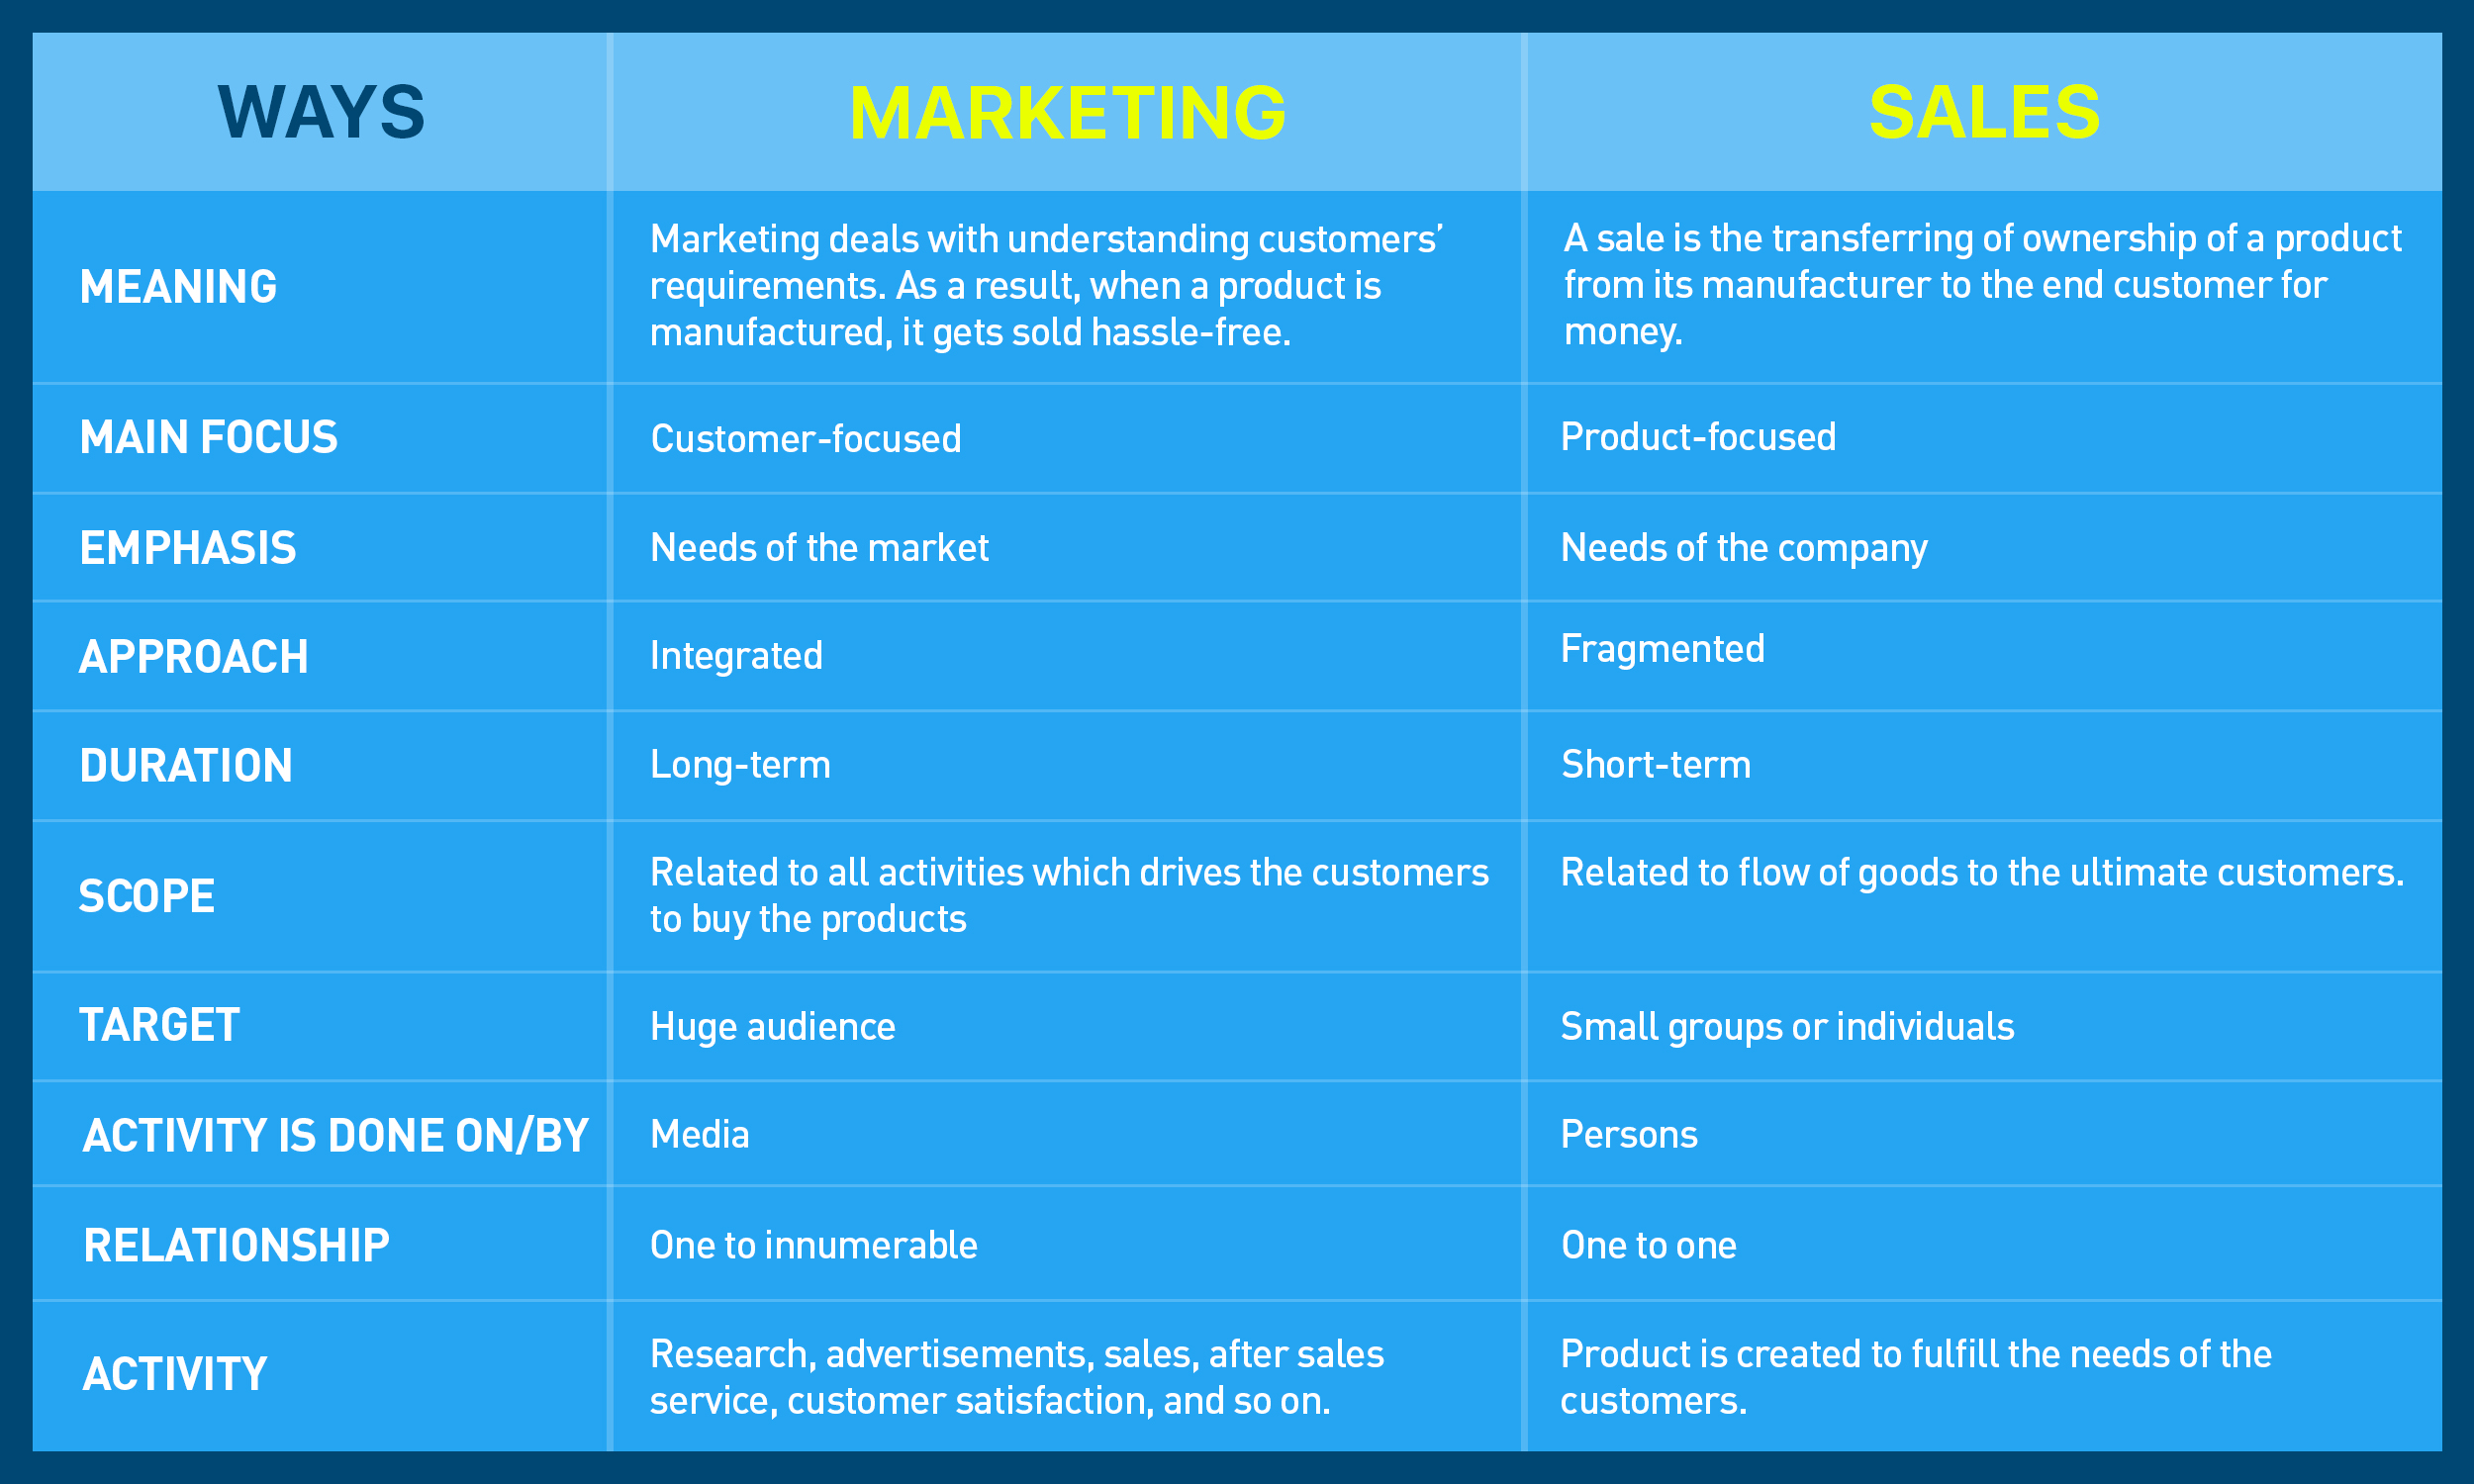
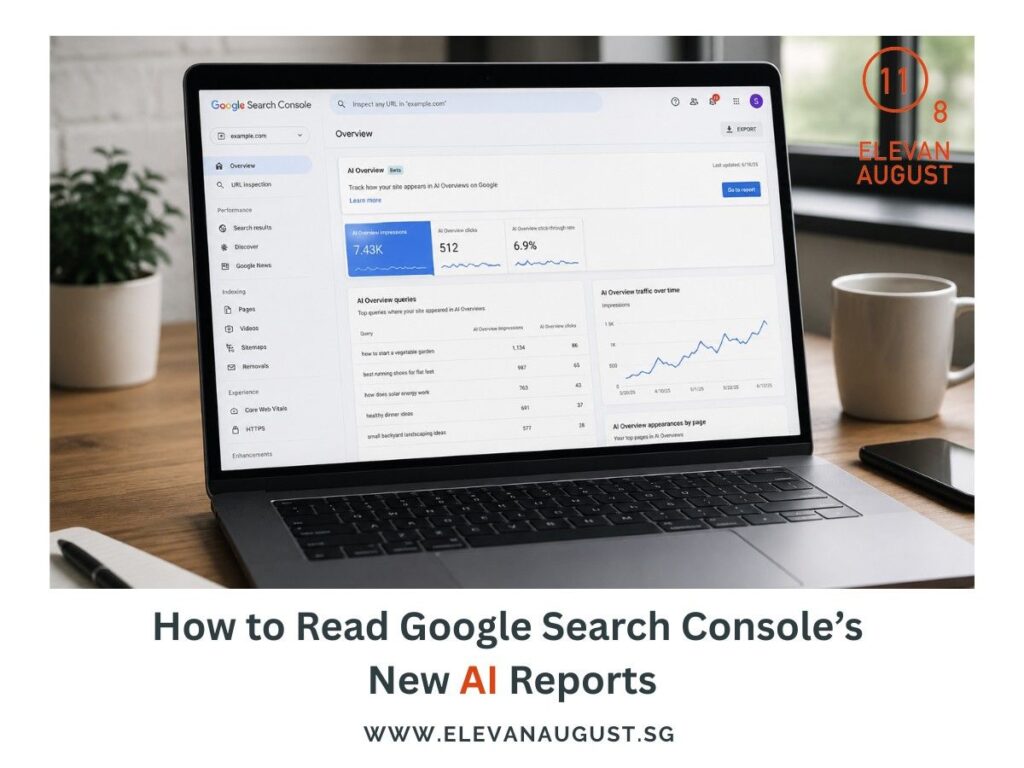
Google Search Console’s new AI reports show where your site appears within Google’s generative results.
While the dashboard is straightforward, the data requires a different interpretation from a typical traffic report.
An increase in impressions reflects greater visibility, but it does not directly translate to clicks or enquiries. These reports help you identify which pages are appearing, along with the countries and devices involved.
Understanding this context makes it easier to interpret the data and decide what to focus on next. Here’s how to read the data and decide what deserves attention.
Start with the report’s actual scope
The Search report covers impressions from AI Overviews and AI Mode, while Discover has a separate generative report.
Google is rolling access out gradually, and a site may also need enough impressions before the report appears.
The Search view centres on impressions, with breakdowns by page, country, device, and date. Search Labs experiments sit outside the report, so the figures cover supported live features.
Understand what one impression represents
An impression records a moment when a link from your site appeared inside a supported generative feature. It records exposure rather than a visit, click, or enquiry.
The chart is aggregated at property level. If two links from the same site appear in one generative result, the chart counts one property impression; adding a URL filter changes the view to URL-level aggregation.
The same data already contributes to the main Search Performance report, so adding both totals would count the same visibility twice.
Read the trend line over a useful period
A four-week comparison usually gives you a steadier starting point than a daily snapshot.
Compare the latest complete period with the previous one, then check whether the movement began around a page update, technical fix, campaign, or Google change.
Custom annotations can mark those events on Search Console charts. The dotted end of the line represents preliminary data that may still change, so completed dates carry more weight.
Search Console records dates in Pacific Time. Singapore teams should account for the time difference when matching chart movements with local publishing records or analytics.
Use the Pages view to find the real pattern
The Pages table shows which final URLs appeared in Google’s generative features, with most data assigned to the canonical URL. Sorting by impressions reveals whether visibility is spread across useful pages or concentrated in one outlier.
Group the leading URLs by purpose because service pages, product pages, comparisons, guides, and location pages play different commercial roles. The same total can mean very different things across those page types.
For example, a service page gaining visibility deserves a review alongside calls and form submissions. An unrelated article carrying most impressions may show that Google understands your educational content more clearly than your core offer.
5. Add country and device context
Country data shows where the search originated, which helps you separate relevant market exposure from broader international visibility.
For a Singapore-focused business, a smaller rise from Singapore may carry more value than a larger increase from markets the company rarely serves.
Device data shows whether the impression came from mobile, desktop, or tablet search. A mobile-heavy pattern can guide a review of speed, navigation, form completion, and key information placement.
Use the same filters in Search Console and Google Analytics so the comparison stays consistent.
6. Know which questions the report leaves open
The dedicated report currently focuses on impressions and excludes query lists, clicks, click-through rate, and average position from the view. It also leaves out the wording around your link and the exact role your page played in the generated answer.
Chart and table totals may differ because they use different aggregation rules, while the usual Search Console limits still apply. These are reporting boundaries rather than signs of faulty tracking.
The report tells you where visibility occurred, while other data sources explain what happened afterwards.
7. Connect AI visibility with traffic and lead data
Start with the pages gaining or losing AI impressions, then follow those URLs into the standard Search report and Google Analytics.
Compare organic clicks, branded search patterns, landing-page engagement, form submissions, calls, and assisted conversions.
Keep a monthly record of the page, impression change, market, device, recent content work, and resulting enquiries. Over time, this shows which updates expanded useful visibility and which ones only lifted the dashboard total.
Search Console and Google Analytics measure different stages, so their totals will vary. Focus on whether the trends move together and whether the pages gaining visibility support business results.
What to Do Next with Your AI Report Insights
Google Search Console’s AI reports work best as an early signal inside a wider measurement process. They show where generative visibility is building, while page analysis, analytics, and lead records reveal whether that exposure is helping the business.
The right SEO agency in Singapore can help connect these sources and turn the report into a regular review process.
Our team at Elevan August combines Search Console findings with website analytics, content changes, and enquiry data, so each recommendation starts with evidence and stays tied to a clear business outcome. Get in touch with us and let’s talk.